Optimizing European Ad Campaigns in the GDPR Era
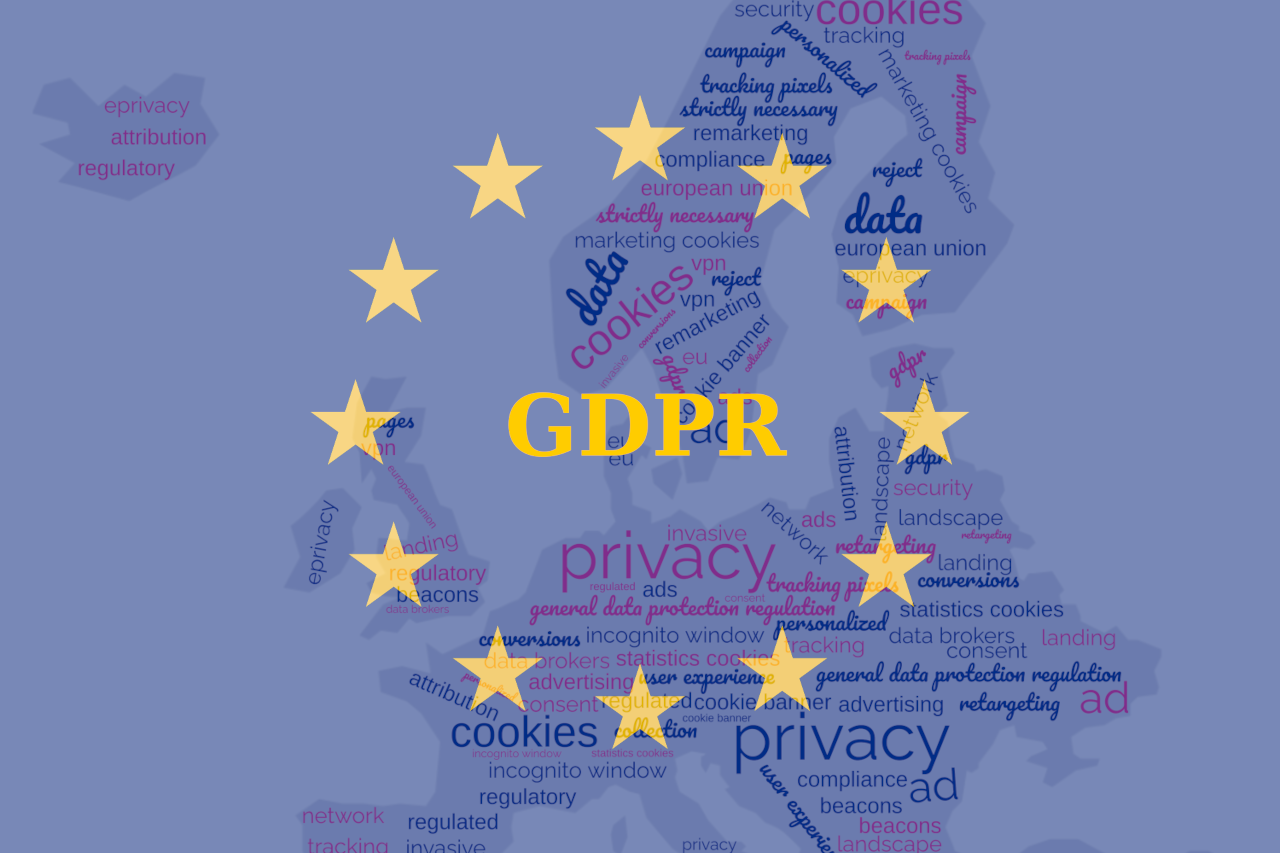
General Data Protection Regulation (GDPR) has had a huge effect on the web in Europe and on advertising in particular …
David Fischer

Respecting user privacy doesn't mean flying blind. While we don't track or store personal data at EthicalAds, running an ad network does generate a ton of data! This is data like the publishers where certain ads perform best or the best time of day or region to run certain ads.
However, the data was a bit hard to explore, let alone creating and telling a compelling story from the data. It was tied up in PostgreSQL and usually required complex joins to get at anything meaningful. We knew the data we were collecting could help us understand and improve our product, but exploring our data, understanding it, and presenting it to our advertisers, publishers, or even just ourselves was hard.
We knew we needed a tool to bridge the gap between what we had and what we wanted to know. Ideally, it could help us with exploration, tracking our key performance indicators, and presenting data to our advertisers, publishers, and ourselves.
We gave Metabase a try on a glowing recommendation from Eric Berry, who previously founded CodeFund, another company dedicated to ethical advertising. Eric raved about Metabase and used it in CodeFund's product before it shut down.
Maybe as developers we have an implicit bias against data analysis and BI tools or maybe it's just me and I hadn't found one I liked. However, after trying Metabase, I was hooked. You could explore data with or without SQL, share graphs with coworkers, and there was an easy and secure way to embed them into our product. Lastly, this never impacts production since our setup exclusively connects to a read-replica.
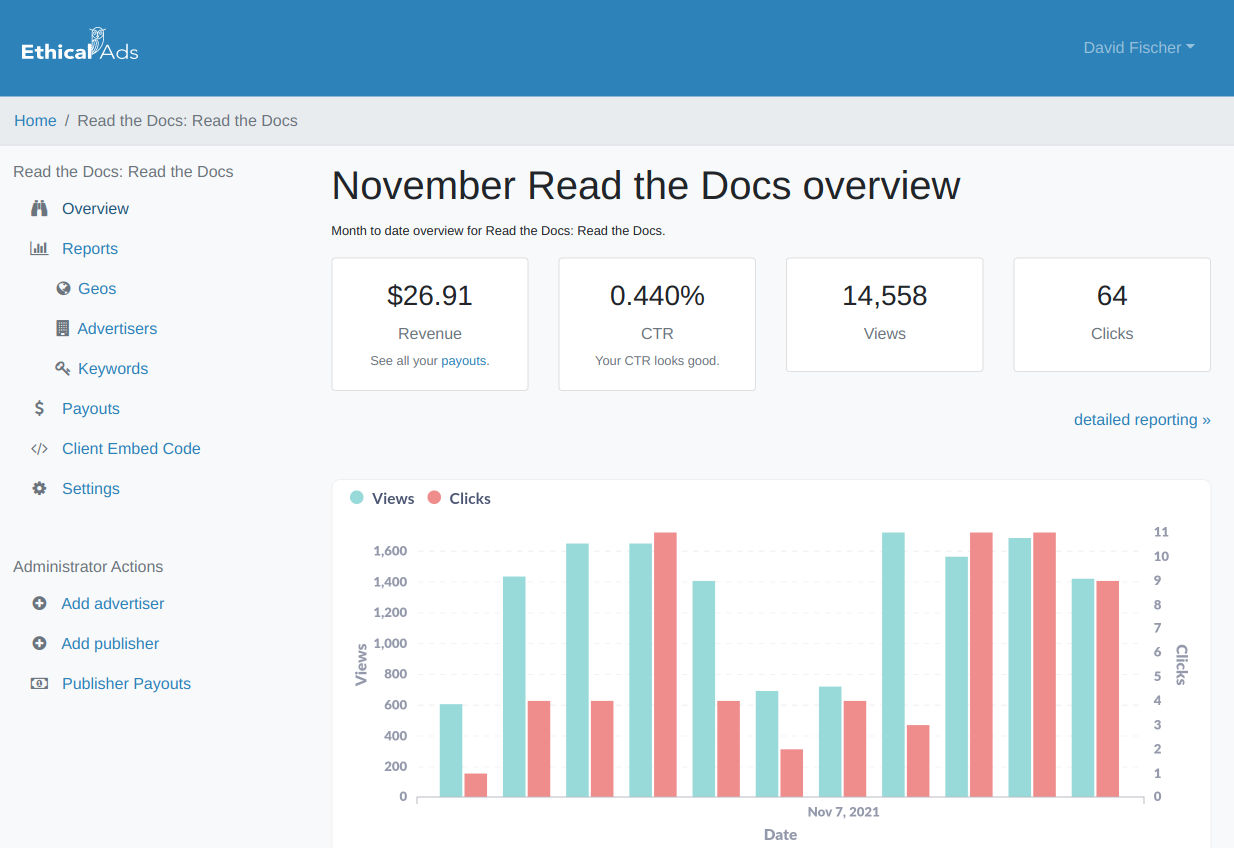
The EthicalAds dashboard with an embedded Metabase graph
In about a week, we went from no data stack at all, to taking visualizations from the exploration stage right into production. It was easy to explore our data and there was a nice way to embed graphs and charts directly into our ad server for advertisers and publishers. It also became an invaluable way to track our business KPIs. Metabase is the perfect tool for a small team like ours.
A few months back, we started collecting data on how long an ad is on the screen (we call it "view time"). We think this is a really valuable metric in understanding what leads to clickthroughs and we think that advertisers will really like it. Advertisers routinely tell us they love all the data we share with them and that other networks are far less transparent.
Over the next couple months, we'll be diving into this and other data. Hopefully we'll have some great insights to share.
General Data Protection Regulation (GDPR) has had a huge effect on the web in Europe and on advertising in particular …